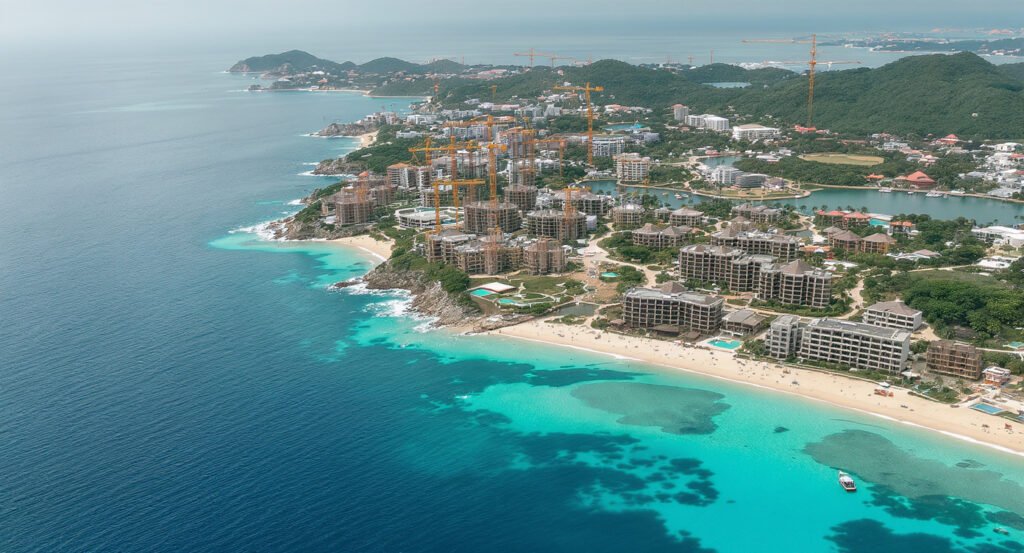
Lombok’s property market between 2020 and 2026 tells a six-year story of disruption, recovery, and accelerating growth. The pandemic compressed a market already building momentum. The Mandalika infrastructure cycle then drove an appreciation curve steeper than most emerging markets produce. And 2025–2026 has entered early maturity — when speculative risk gives way to proven fundamentals, but prices have not yet caught up to the destination market Lombok is becoming.
This Lombok property market analysis covers the data year by year: what happened to prices, transaction volumes, and yields, why it happened, and what 2026 and beyond looks like based on the structural evidence.
Use the Lombok ROI Calculator to model returns at current market prices. This analysis provides the market context; the calculator applies it to your specific scenario.
2020–2021: The Pandemic Pause
COVID-19 halted Indonesia’s tourism economy in March 2020. International arrivals to Lombok — approximately 450,000 in 2019 — collapsed to near zero. Short-stay rental occupancy fell 75–80%. Land prices in Kuta and the Mandalika corridor fell approximately 10–20% from peak 2019 levels.
The Indonesian government accelerated Mandalika SEZ development through the construction pause, completing infrastructure ahead of schedule. Land inside the Mandalika SEZ traded at approximately USD 60–80/m² at the 2020–2021 trough. By 2026 that same land is USD 185–490/m². Investors who bought during this window captured 3–6× appreciation in five years.
2022: The Recovery Inflection
Indonesia lifted international travel restrictions in March 2022. According to BPS Indonesia tourism data, international arrivals to Lombok reached approximately 280,000 — roughly 60% of 2019 levels. The inaugural Mandalika MotoGP round in March 2022 was the market’s proof-of-concept moment: over 87,000 spectators attended, global broadcast coverage reached 200 million viewers, and Lombok’s international profile shifted. Within weeks of the March 2022 race, land enquiries in the Mandalika corridor surged.
Price movements 2022: Land in the Mandalika zone rose approximately 18–22% from 2021 trough levels. Villa transactions in Kuta recovered to approximately 80% of pre-COVID volumes.
2023: Establishing the Growth Corridor
The 2023 Lombok property market analysis data shows arrivals reaching approximately 530,000 — surpassing pre-pandemic 2019 levels. The 2023 MotoGP round generated over 100,000 visitor arrivals. South Lombok transaction volumes increased approximately 35% year-on-year from 2022. Documented gross yields on managed villas in the Kuta/Mandalika zone reached 12–16%.
Land prices 2023: Mandalika SEZ core zone reached USD 120–180/m² for development-ready plots. Kuta villa inventory: USD 200,000–450,000 for 2–3 bedroom managed properties.
2024: Lombok Property Market Analysis — Acceleration and Proof
2024 is the most data-rich year for the Lombok property market analysis — the first year with multiple operating seasons of post-Mandalika rental data available.
Tourism: International arrivals reached approximately 700,000–800,000 — growth of 35–50% over 2023. New international routes from Singapore, Kuala Lumpur, and Darwin expanded direct access. The 2024 MotoGP round exceeded 100,000 arrivals.
Land Prices 2024
| Zone | 2024 Land Price | YoY Change |
|---|---|---|
| Mandalika SEZ core | USD 185–490/m² | +20–25% |
| Kuta secondary | IDR 3.5–6M/m² (~USD 215–368/m²) | +18–20% |
| Selong Belanak | IDR 1.5–3.5M/m² | +18–20% |
| Gili Trawangan | USD 300–600/m² | +10–14% |
Villa Prices 2024
| Zone | 2-bedroom managed villa |
|---|---|
| Kuta / Mandalika zone | USD 180,000–380,000 |
| Kuta prime (3-bed pool) | USD 300,000–550,000 |
| Selong Belanak | USD 130,000–250,000 |
| Gili Trawangan | USD 250,000–500,000 |
Appreciation CAGR (2021–2024, Verified)
| Asset | CAGR 2021–2024 |
|---|---|
| Kuta/Mandalika land | 18–22% |
| Kuta villas | 15–18% |
| Selong Belanak land | 15–18% |
| Gili Trawangan property | 8–12% |
2025–2026: Early Maturity Phase
The Lombok property market analysis for 2025–2026 confirms: infrastructure delivered, demand sustained, yields proven, and appreciation documented. International arrivals are projected at 1.2–1.4 million for 2025. The 2025 MotoGP round delivered another 100,000+ arrivals.
Key hospitality openings 2025–2026: Hyatt’s Saraya Bay luxury resort anchored the north Mandalika precinct. Multiple 5-star completions across the SEZ perimeter. The Mandalika retail and F&B precinct opened in phases. Each opening raises average nightly rate benchmarks for neighbouring villa inventory.
Current prices 2026: Kuta/Mandalika land at USD 215–500/m² in prime zones. Mid-tier managed villas priced at USD 200,000–500,000 for 2–3 bedroom properties. Selong Belanak showing 18–22% annual appreciation as demand catches up with south Lombok’s profile.
Yields in 2026: Gross yields have compressed slightly from the 2023 peak — current Kuta/Mandalika range is 12–16% (versus 14–18% in 2023) as supply of managed villas increased. This compression is normal and expected as a market matures. Net yields of 6–9% in the prime zone remain among the highest in Southeast Asia for comparable product. For the full yield breakdown, read the Lombok Rental Yield Guide.
Lombok vs Southeast Asia: Relative Positioning
| Market | Entry villa (2-bed) | Gross yield | 5yr appreciation CAGR |
|---|---|---|---|
| Lombok (Kuta/Mandalika) | USD 150k–350k | 12–16% | 15–20% |
| Bali (Canggu/Seminyak) | USD 400k–800k | 8–12% | 4–6% |
| Phuket (Rawai/Kata) | USD 200k–500k | 7–10% | 6–9% |
| Koh Samui | USD 250k–600k | 6–9% | 5–8% |
For a head-to-head comparison with Bali, see Bali vs Lombok Property Investment: Which Wins in 2026?
2026–2030 Outlook
Based on documented market drivers and infrastructure pipeline, this Lombok property market analysis points toward the following for 2026–2030:
Appreciation: Expected 10–15% CAGR across the primary investment corridor (Kuta, Mandalika zone, Selong Belanak). The 18–22% annual appreciation of 2022–2024 is unlikely to be sustained indefinitely — normalisation toward 12–16% is the more realistic planning base.
Yields: Net yields of 5–9% in the prime zone are sustainable given the tourism growth trajectory. Occupancy rates are expected to increase toward 70–78% for professionally managed properties in the Kuta/Mandalika corridor by 2028.
Entry price trajectory: USD 200,000 for a 2-bedroom managed villa in Kuta Lombok in 2026 is likely USD 320,000–450,000 by 2030 at the conservative 12% CAGR. The current window captures the price before that normalisation completes.
Conclusion: What the Lombok Property Market Analysis Tells Investors
Six years of Lombok property market analysis data tell a consistent story: a market that absorbed a pandemic pause, accelerated through proven infrastructure catalysts, and is now delivering documented returns while still offering meaningful entry price advantages over competing Southeast Asian destinations.
The 2020–2021 window — the best entry point — has passed. The 2022–2026 window has been strong. The 2026–2030 window is the productive middle phase: risks are better understood, returns are documented, and the appreciation differential to comparable markets remains significant.
The 7 mistakes foreign investors make in Indonesia are the same mistakes investors make in every emerging market at this stage. Avoiding them while the window is open is the entire Lombok investment thesis.
Use the Lombok ROI Calculator to model your specific property scenario. Download the free Lombok Investment Guide (PDF) for a printable summary of market data and investment checklists.
All market data represents current estimates based on available market reporting as of 2026. Past appreciation is not indicative of future performance. Consult a qualified Indonesian notaris and financial adviser before making investment decisions.

Author: Brusca
Living in Indonesia for 15 years, with hands-on experience in how the Indonesian real estate industry actually works. Lombok is currently the fastest-growing property market in Southeast Asia. Every listing on this site is vetted where timing allows.







Leave a Reply